Spatiotemporal expression patterns of genes coding for plasmalemmal chloride transporters and channels in neurological diseases | Molecular Brain | Full Text
A developmental gene expression landscape of brain
Similar neural functions are often generated in a specific time window, and associative transcriptomic states present consistent neuronal development dynamics [26, 27]. Studying transcriptional regulation across brain development periods can facilitate the understanding of brain functions and cellular mechanisms that underlie brain diseases [28]. Short time-series expression miner (STEM) software is widely used to study gene expression data of biological processes with short time series [20]. It adopts a clustering algorithm to classify time series gene expression trends. In this study, we used STEM software to cluster genes with similar temporal expression patterns, whose expression changes synchronously during brain development.
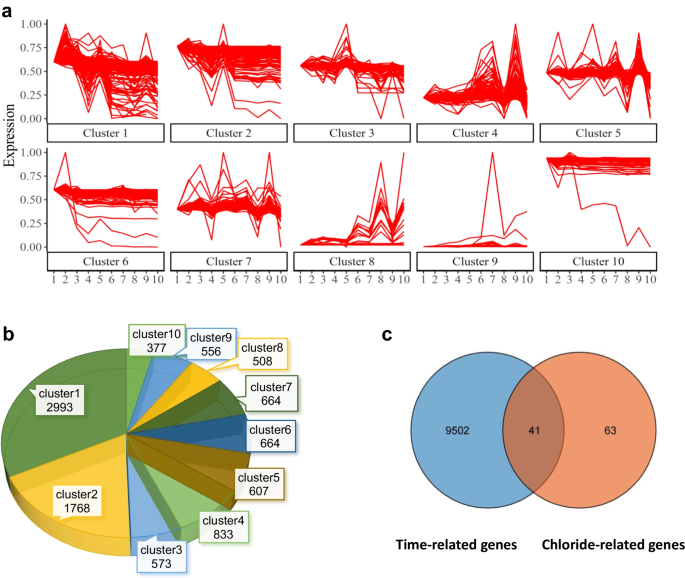
The transcriptomic data for human brain genes were obtained from the Atlas of the Developing Human Brain database. We focused on transcriptomic changes during hippocampal development as it is a representative biological process in the development of brain regions [29]. Ten time points (from 12 post-conception weeks to 18 years) representing different developmental periods were selected for further analysis (Additional file 1: Table S1). A total of 9543 genes were screened out by STEM, and we defined these genes with temporal expression features as “developmental-stage dependent genes”. They were further classified into different groups as clusters, according to their unique time sequence change characteristics and different expression kinetics. 10 clusters with statistical differences were selected. They were ordered by their statistical significance in Fig. 2a and Additional file 2: Table S2. The number of clusters is marked in a pie chart (Fig. 2b).
Temporal gene expression profiles in the developing brain. a The series of diagrams illustrates the developmental changes in gene expression patterns during the developmental period. The x-axis represents 10 developmental periods. The numbers 1 to 10 correspond to12 pcw, 13 pcw, 17 pcw, 21 pcw, 24 pcw, 4 mos, 1 yrs, 3 yrs, 8 yrs, 18 yrs, respectively. The y-axis represents the normalized gene expression changes at each period. b Pie chart showing the number of genes in each cluster in (a). c Venn diagram showing the temporal expression genes (9543 genes) intersected with GClTC (104 genes). pcw post-conception week, mos months, yrs years
Temporal gene expression profiles in the developing brain. a The series of diagrams illustrates the developmental changes in gene expression patterns during the developmental period. The x-axis represents 10 developmental periods. The numbers 1 to 10 correspond to12 pcw, 13 pcw, 17 pcw, 21 pcw, 24 pcw, 4 mos, 1 yrs, 3 yrs, 8 yrs, 18 yrs, respectively. The y-axis represents the normalized gene expression changes at each period. b Pie chart showing the number of genes in each cluster in (a). c Venn diagram showing the temporal expression genes (9543 genes) intersected with GClTC (104 genes). pcw post-conception week, mos months, yrs years
Considering the intracellular chloride ion concentration is directly mediated by chloride transporters and channels, we focus on their GClTC in our study and explore their roles during development. We first identified the target genes using the term “chloride transmembrane transport (GO:1902476): the process in which chloride is transported across a membrane” in the Gene Ontology database [30]. 454 genes of “Homo sapiens” were included in this term. After ruling out the duplicated gene names, 104 GClTC were finally selected for further analysis (Additional file 3: Table S3). Next, we intersected these 104 GClTC with 9543 developmental-stage dependent genes. A total of 41 GClTC were identified (Fig. 2c and Table 1). They were evenly distributed among different clusters, and no obvious clustering was observed in one group.
Pathways associated with expression patterns
Genes with temporal expression features may be involved in time-dependent developmental functions. Therefore, we conducted GO and KEGG enrichment analyses of the genes from 10 clusters. Each cluster exhibited unique biological characteristics (Additional file 8: Fig. S1 and Additional file 4: Table S4).
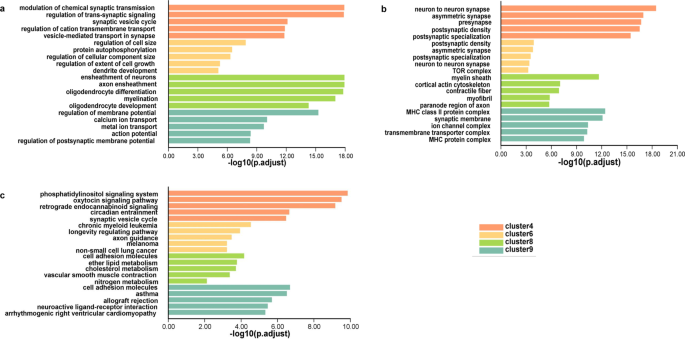
Notably, we found genes from clusters 4, 6, 8, and 9 were mainly enriched for CNS-specific terms (Fig. 3). For example, in biological processes (BP) most terms of clusters 4 and 9 were related to signal regulation in the CNS. Cluster 6 contained terms for the regulation of cell morphogenesis. Cluster 8 included terms related to ensheathment formation, which belonged to non-neuronal cell components. Moreover, the enriched cellular component (CC) analysis corresponded with the BP-associated locations, such as synapse in clusters 4 and 9, and myelin sheath in cluster 8. KEGG analysis revealed that clusters 4, 6, and 9 tended to trigger pathways involved in regulating neural signals, such as phosphatidylinositol signaling pathway, oxytocin signaling pathway, and axon guidance. According to the above results, the genes in clusters 4, 6, 8, and 9 may be of great importance in neural functions. We observed that 22 GClTC were present in those 4 clusters, suggesting they may regulate the corresponding neuronal functions.
Molecular characteristics of the developmental expression patterns. a GO analysis (biological processes, BP) of genes in clusters 4, 6, 8, and 9. b GO analysis (cellular components, CC) of the genes in clusters 4, 6, 8, and 9. c KEGG analysis of the genes in clusters 4, 6, 8, and 9
Heterogeneity of GClTC expression across cell subtypes
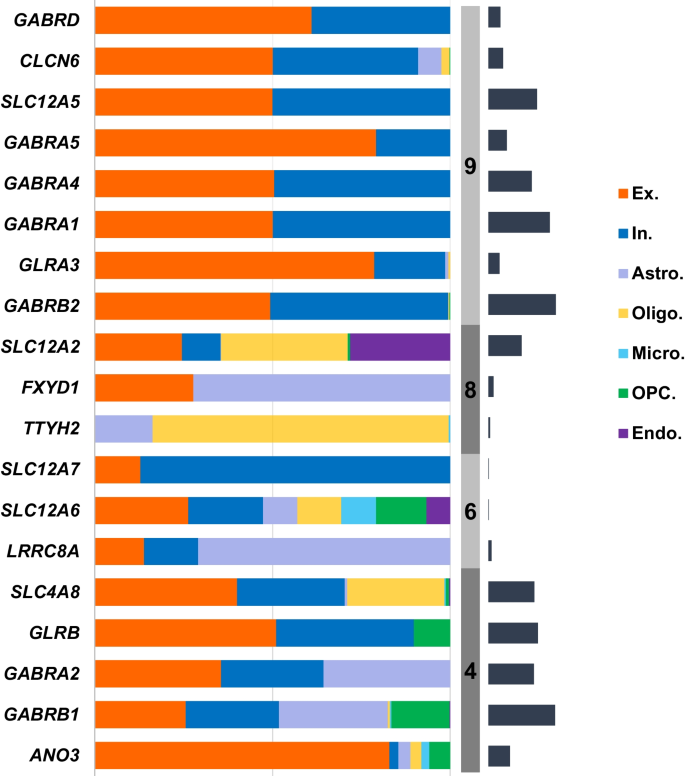
We then investigated the distribution of GClTC involved in the regulation of CNS functions in different cell types. The single-cell transcriptomics data were obtained from the Multiple Cortical Areas-Smart-Seq [17]. As shown in Fig. 4, the genes in clusters 4 and 6 showed no preference for certain cell types; however, the genes in cluster 9 were expressed mainly in neurons, with minimal expression in non-neuronal cells. The genes in cluster 8 were mainly expressed in glial cells. To investigate whether these genes and the specific cell types were determined during early development, we selected some GClTC using the Spatio-Temporal cell Atlas of the human Brain (STAB) to evaluate their expression dynamics in different cell types. Representative genes selected from the different clusters are shown in Additional file 9: Fig. S2. The results indicated that remarkable changes in expression levels during development were detected in specific cell types, consistent with the distribution of these genes in adults.
Expression levels of GClTC in different cell types. The salmon-colored bars indicate the percentage of gene expression in each cell type. The gray-colored bars indicate the clusters. The dark blue-colored bars on the right indicate the relative expression of gene levels in the brain. Genes with extremely low expression were removed. Ex excitatory neuron, In inhibitory neuron, Astro astrocyte, Oligo oligodendrocyte, Micro microglial cell, OPC oligodendrocyte precursor cell, Endo endotheliocyte
Expression levels of GClTC in different cell types. The salmon-colored bars indicate the percentage of gene expression in each cell type. The gray-colored bars indicate the clusters. The dark blue-colored bars on the right indicate the relative expression of gene levels in the brain. Genes with extremely low expression were removed. Ex excitatory neuron, In inhibitory neuron, Astro astrocyte, Oligo oligodendrocyte, Micro microglial cell, OPC oligodendrocyte precursor cell, Endo endotheliocyte
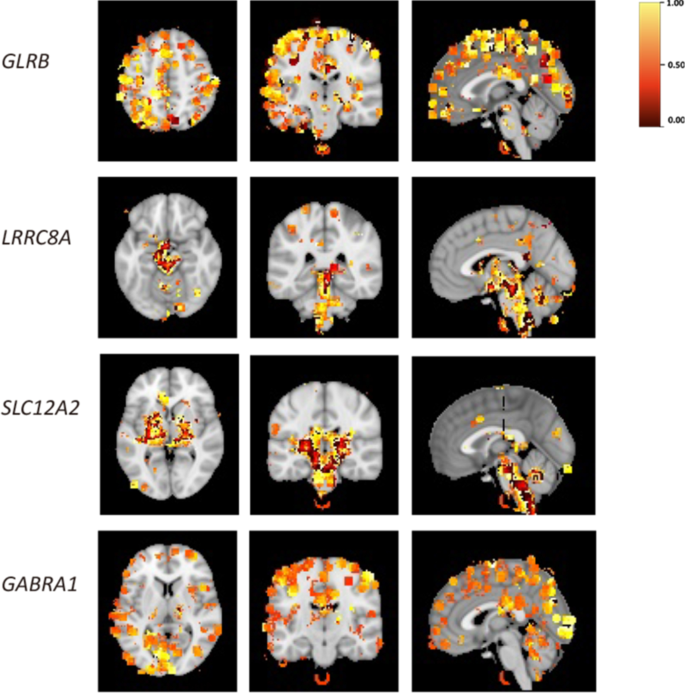
To explore the spatial expression features of GClTC clusters in the brain, we downloaded spatial gene expression maps of specific genes of interest from the Neurosynth [23]. Neurosynth is a large database of mappings structured by text-mining, meta-analysis, and machine-learning techniques. We used the Neurosynth-Gene module to explore gene expression levels in a whole-brain map. The distribution of all genes of interest is shown in Additional file 10: Fig. S3 and Additional file 5: Table S5, and the representative genes from different clusters are shown in Fig. 5. We found that the members of cluster 4 were observed with relatively higher expression levels in the cortical area. The GClTC in cluster 6 were mainly expressed in the basal brainstem and ganglia. Moreover, the GClTC in cluster 8 were also highly expressed in the brainstem, basal ganglia, and thalamus. The gene expression levels in cluster 9 were higher in the visual cortex, temporal lobe, parietal lobe, and hippocampus. These results showed that GClTC present anatomical heterogeneity in different clusters.
Spatial expression patterns of GClTC in the brain. These figures show the brain regions with high levels of GClTC. Representative genes were selected from different clusters. The heatmap indicates a correlation; yellow indicates a relatively high correlation, while red indicates a relatively low correlation. The thresholds followed the settings we have set in Neurosynth.org. GLRB in cluster 4, is mainly expressed in the cerebral cortex. LRRC8A in cluster 6, is mainly expressed in the brainstem, midbrain, and thalamus. SLC12A2 in cluster 8, is mainly expressed in the thalamus, brainstem, and basal ganglia. GABRA1 in cluster 9, is predominantly expressed in the cerebral cortex, particularly in the visual cortex and parietal lobe
Spatial expression patterns of GClTC in the brain. These figures show the brain regions with high levels of GClTC. Representative genes were selected from different clusters. The heatmap indicates a correlation; yellow indicates a relatively high correlation, while red indicates a relatively low correlation. The thresholds followed the settings we have set in Neurosynth.org. GLRB in cluster 4, is mainly expressed in the cerebral cortex. LRRC8A in cluster 6, is mainly expressed in the brainstem, midbrain, and thalamus. SLC12A2 in cluster 8, is mainly expressed in the thalamus, brainstem, and basal ganglia. GABRA1 in cluster 9, is predominantly expressed in the cerebral cortex, particularly in the visual cortex and parietal lobe
GClTC enriched for different CNS disorders
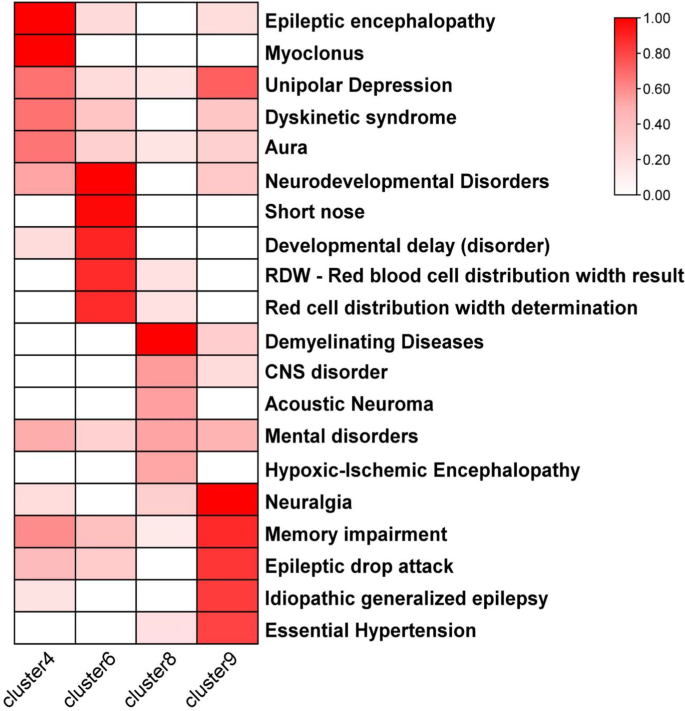
The GClTC from different clusters have unique expression characteristics. As the genes in clusters 4, 6, 8, and 9 were enriched for some CNS-specific terms, we further investigated the connections between those genes and diseases. The DisGeNET database, which offers rich information of genes and variants associated with many kinds of human diseases, was used to enrich for the diseases with all genes in clusters 4, 6, 8, and 9. We observed that genes from these 4 clusters were enriched for distinct diseases, most of which were CNS disorders (Fig. 6 and Additional file 6: Table S6). Clusters 4 and 9 were positively and similarly enriched for epilepsy. Cluster 6 was enriched for neurodevelopmental disorders. “Demyelinating diseases” was glaringly enriched in cluster 8.
Gene-disease association analysis of genes in different clusters. The heatmap shows the zero to one transformed values of the disease terms in the gene-disease association analysis describing each of the 4, 6, 8, and 9 clusters
As shown in our findings (Figs. 3, 4, 5), GClTC in different clusters exhibited functional and anatomical heterogeneity. We speculated that the heterogeneity might account for their different roles in different CNS diseases. To test our hypothesis, we selected typical GClTC to illustrate the intrinsic connection between their expression features and CNS diseases.
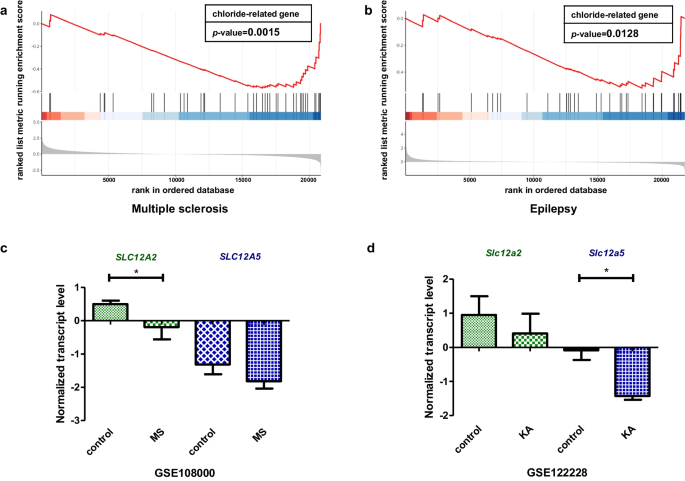
The neuronal chloride ion gradient is primarily established by cation-chloride cotransporters (CCCs) from the SLC12A gene family, especially the chloride ion importer sodium potassium chloride cotransporter-1 (NKCC1) and the chloride ion exporter potassium chloride cotransporter-2 (KCC2). NKCC1 and KCC2 encoded by SLC12A2 and SLC12A5, respectively [31]. The abnormal transcriptional regulations of these two genes lead to multiple neurological disorders resulting from disrupted chloride homeostasis. According to the previous analysis (Table 1 and Fig. 6), SLC12A2 was classified in cluster 8 related to demyelinating diseases, while SLC12A5 was classified in cluster 9 related to epilepsy. To further confirm their relationship with the enriched diseases, we examined their heterogeneity in two Gene Expression Omnibus (GEO) datasets, multiple sclerosis (MS) (GSE108000) (one of the most common demyelinating diseases) and epilepsy (GSE122228), both of which were strongly associated with chloride homeostasis disorder [32, 33]. We next defined 104 GClTC as a gene set (Additional file 2: Table S2). GSEA was conducted to determine whether those genes showed statistically significant, concordant differences in MS and epilepsy. The results showed that the defined gene set was significantly enriched in multiple sclerosis (p < 0.05) (Fig. 7a) and epilepsy (p < 0.05) (Fig. 7b), indicating that GClTC were involved in disease mechanisms. Then, we compared mRNA levels of SLC12A2 and SLC12A5 in MS and epilepsy separately (Fig. 7c, d and Additional file 7: Table S7). SLC12A2 showed no significant difference in models with epilepsy compared to the controls (control mean ± SD = 0.952 ± 0.943, KA mean ± SD = 0.412 ± 0.994, p = 0.532, Student’s t-test), but it was significantly decreased in multiple sclerosis [control median (IQR) = 0.511 (0.392), MS median (IQR) = 0.200 (0.597), p = 0.035, Wilcoxon test]. In contrast, SLC12A5 expression levels were significantly decreased in epilepsy (control mean ± SD = − 0.086 ± 0.486, KA mean ± SD = − 1.428 ± 0.192, p = 0.028, Student’s t-test) but not in demyelinating diseases [control median (IQR) = − 1.530 (1.246), MS median (IQR) = − 1.955 (0.451), p = 0.237, Wilcoxon test]. This result implied that the expressions of SLC12A5 and SLC12A2 had different effects on the pathological mechanisms of these two diseases.
SLC12A2 and SLC12A5 mRNA levels in different CNS disorders. a The GClTC set enrichment analysis between health control and MS patient (p = 0.002). b The GClTC enrichment analysis between control and KA (Kainic acid)—induced epileptic model (p = 0.013). c SLC12A2 mRNA (W = 54, p = 0.035, Wilcoxon test), SLC12A5 mRNA (W = 43, p = 0.237, Wilcoxon test) normalized expression level in health control and MS patient. Values represent the median (IQR). d Slc12a2 mRNA (t(4) = 0.683, p = 0.532, Student’s t-test) and Slc12a5 mRNA (t(4) = 4.446, p = 0.028, Student’s t-test) normalized expression level in health control and epileptic model. Values represent mean ± SD. *p < 0.05
SLC12A2 and SLC12A5 mRNA levels in different CNS disorders. a The GClTC set enrichment analysis between health control and MS patient (p = 0.002). b The GClTC enrichment analysis between control and KA (Kainic acid)—induced epileptic model (p = 0.013). c SLC12A2 mRNA (W = 54, p = 0.035, Wilcoxon test), SLC12A5 mRNA (W = 43, p = 0.237, Wilcoxon test) normalized expression level in health control and MS patient. Values represent the median (IQR). d Slc12a2 mRNA (t(4) = 0.683, p = 0.532, Student’s t-test) and Slc12a5 mRNA (t(4) = 4.446, p = 0.028, Student’s t-test) normalized expression level in health control and epileptic model. Values represent mean ± SD. *p < 0.05
As temporal demands drive the evolution of neural diversity, time is regarded as a key metric for all brain operations. With neural signals sending out specific programs to start or stop neurogenesis, distinct functions are generated in specific time windows during neuronal development, which is driven by multiple molecular events [34, 35]. Therefore, those gene expression that change synchronously during development may play a key role in the establishment of brain functions from simple to complex. Thus, understanding the transcriptional dynamics of crucial genes may help interpret the functional heterogeneity underlying neurodevelopmental processes. Time series analysis can help to understand related information surrounding biological processes, and it has been used in studies of a variety of species, including Drosophila, Arabidopsis thaliana, and so on [36, 37]. The STEM, a time series analysis software, allows us to screen genes with similar variation expression dynamics in mRNA levels. In this study, we used STEM to cluster genes whose expression changed synchronously during brain development. As chloride-mediated signals are involved in the formation of neural function during early development, we believe that taking a developmental perspective in investigation can help us better understand the neural regulatory mechanisms where GClTC are involved.
To illustrate the relevance between expression trends and biological functions, we clustered genes with similar expression dynamics and enriched their biological functions. Some clusters targeted enrichment terms for transcriptional regulation, division regulation, and energy metabolism, which belong to general cell functions (Additional file 8: Fig. S1). Interestingly, some enrichment terms were related to specific neural cell functions. For instance, genes in cluster 4 were enriched for the function of synaptic components, signal transmissions, and targeted neuron-related pathways such as the phosphatidylinositol signaling pathway. The phosphatidylinositol signaling system regulates cellular functions such as receptor signaling, secretion, and endocytosis. The disorder of phosphoinositide system leads to brain fail to react appropriate responsive to stimuli, which is associated with several neurological diseases [38, 39]. Therefore, we suggest that classifying genes based on their temporal expression may help screen for biological characteristics related to neurodevelopmental processes.
We further focused on the GClTC in these CNS-related clusters. Most GClTC have been reported to be involved in the corresponding functions, as shown in our results. These gene functions are consistent with the enriched term in cluster 4 (regulating synaptic signaling), Anoctamin 3 (ANO3) has been reported to control the excitability of synapses in the hippocampus in response to hyperthermia [40, 41]. Solute carrier family 12 member 6 (SLC12A6) and solute carrier family 12 member 6 (SLC12A7) help maintain cell volume and intracellular chloride levels [42], concordant with their functions in cluster 6. The gene tweety family member 2 (TTYH2) in cluster 8 constitutes the volume-regulated anion channel (VRAC) that decreases intracellular volumes during cell swelling [43, 44]; it executes glial-related functions. This suggested that GClTC from different clusters might play different and specific roles as opposed to all the GClTC playing the same role during development.
To validate abnormal chloride homeostasis in different diseases is associated with the abnormal transcriptional levels of GClTC from different clusters, we selected two widely known GClTC, SLC12A2 and SLC12A5, which encode proteins NKCC1 and KCC2, for further analysis [55, 56]. KCC2 is the major extruder of intracellular chloride, whereas NKCC1 mediates the influx of chloride ions [57]. These proteins are essential for neural chloride homeostasis. Dysfunction of them could result in the pathogenesis of several brain disorders [58] or abnormal GABAergic signal during brain development [59]. As reported in some research, SLC12A2 presents a relatively high expression level in early development stage in brain and decreases after birth [60]. Interestingly, in temporal single-cell results (Additional file 9: Fig. S2), we found that SLC12A2 expression remained at a low level in neurons, and the slight upregulation was only observed mainly in oligodendrocytes after birth but was stable in neurons (Additional file 9: Fig. S2). Recent research also revealed that NKCC1 protein and mRNA are expressed at remarkably high levels in oligodendrocytes in mice [61]. If dramatic changes in mRNA occur mainly in non-neuronal cells, how it regulates neuronal chloride homeostasis during development warrants further study. Moreover, based on our data, SLC12A2 and SLC12A5 had completely different expression patterns (Fig. 8). SLC12A5 has a pattern similar to that of GABA receptors; it is located in neurons and is mainly involved in regulating neural functions, consistent with previous reports [62,63,64]. In contrast, SLC12A2 mediates the function of non-neuronal cells. It is associated with myelin dysfunction, which has rarely been reported. Although, SLC12A2 is regarded as a target gene in epilepsy treatment [65, 66], we found no significant changes in SLC12A2 expression in epileptic models, but they seemed to act more sensitively in demyelinating diseases. Overall, we suggest SLC12A2 may play a more important role in oligodendrocytes than in neurons, and myelination disorders might be much more widespread than what has been thought so far.
